
PAN files are ubiquitous in the solar PV performance modeling world. From preliminary design to construction to the final as-built, PAN files are used in nearly every step of a project’s life. They are the living document that represents PV module production. No PVsyst simulation can run without them. Despite all of this, they are perhaps one of the least-scrutinized aspects of a project’s production model.
An accurate PAN file is critical to solar project model acceptance by an independent engineer (IE). IEs are the gatekeepers of bankability, and no project developer wants to have a model rejected — especially due to an overlooked detail.
At Anza, we strive to simplify and improve the complicated process of module procurement. Here’s a deeper look at PAN files and how Anza ensures that only the most bankable PAN files are included in our platform and NPV rankings.
Differences between manufacturer & third-party PAN files
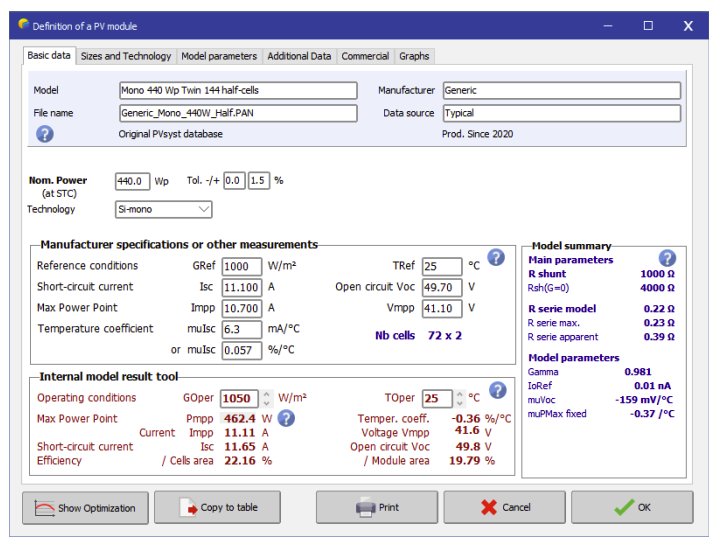
PAN files are small text files with the extension “.PAN,” representing PV module performance and used specifically for running simulations in any version of PVsyst. These files are typically created either by the module manufacturer or by a third-party module testing lab. An example PAN file, as shown opened in PVsyst, is shown below.
A manufacturer first creates a PAN file early in a module’s lifetime before much is known. Although the PAN file may undergo several revisions as more module performance data is collected, the manufacturer is not likely to release any internal test data. Because performance can’t be validated against real-world data, using a manufacturer PAN file in a simulation poses an inherent risk to bankability.
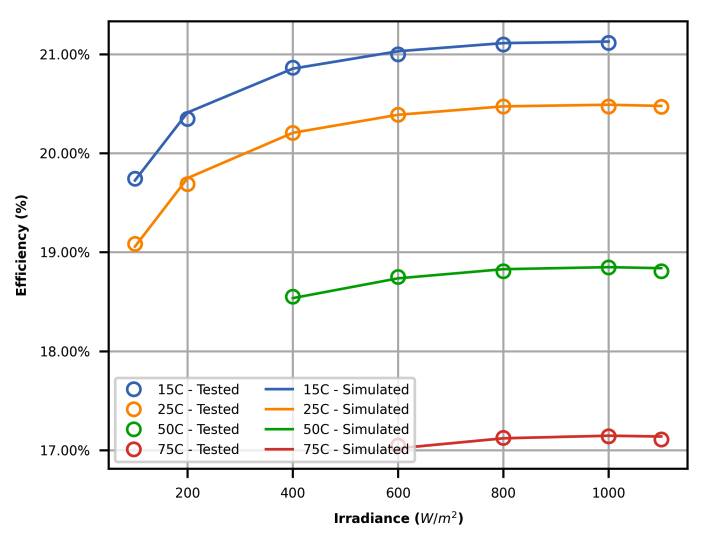
Conversely, third-party PAN files are generated from testing labs based on reported data. Typically, these labs perform flash testing on samples using 22 different irradiance and temperature combinations, as prescribed by IEC standard 61853-1. After completing testing, the labs modify a set of 4-5 parameters in the PAN file to ensure that any simulation matches the test data. An example graph below shows efficiency from simulated curves and tested data points.
Supporting test data makes a third-party PAN file more bankable than a manufacturer’s.
PAN File Characteristics
A PAN file is composed of a few unique parts, all of which contribute to the performance of the module when used in a simulation.
Base PAN File
The “Base” PAN file includes all of the components in the PAN file that collectively determine the module’s temperature and irradiance performance. As discussed, these components can be determined by the manufacturer or a third-party lab.
Light-Induced Degradation
Light-induced degradation (LID) represents performance loss from sunlight within the first few weeks of module exposure.
LID is typically tested at a third-party lab using a specific number of module samples and specific exposure requirements. Testing usually yields a LID value of about a few tenths of a percentage point. Without quality testing data, Anza assumes a conservative LID value of 0.6%.
Incident Angle Modifier
Incident-angle modifier (IAM) measures how much light is reflected off a module’s surface instead of absorbed by the module cell. IAM is typically defined as a profile in which the values vary between 0 and 1 as a function of the incidence angle. An example IAM profile is shown below.
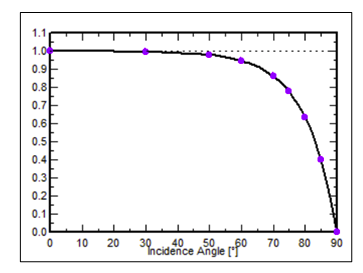
IAM testing is conducted by measuring short-circuit current and calculating an IAM value for each angle tested.
In the absence of IAM test data, Anza uses an ASHRAE profile with b0 = 0.04 for modules with anti-reflective (AR) coating and b0 = 0.05 for modules without AR coating.
Bifaciality Factor
A module’s bifaciality factor is the ratio of its rear-to-front STC power; the higher the bifaciality factor, the higher the project’s bifacial gain.
The bifaciality factor can be derived from testing and usually equates to 0.7 for mono-PERC modules. Without test data, this value is taken from the manufacturer’s datasheet (which is usually listed as 0.7 within a tolerance range).
Power Tolerance
Power tolerance is the upper bound on the module’s power from the binning process, expressed as a percentage of the nominal power.
Power tolerance is used to calculate the module quality loss (MQL) in PVsyst, which is typically calculated as a quarter of the tolerance value. The power tolerance expressed in the PAN file usually results in a performance gain to the model because most manufacturers down-bin their modules.
The Anza PAN file: built to withstand IE scrutiny
One goal of Anza’s technology engine is to provide an accurate yield prediction for each module in its platform. This involves performing due diligence on all module test data and generating an Anza PAN file representing the most updated information about a particular module. The Anza PAN file has been rubber-stamped by the performance team and is ready to stand up to IE scrutiny.
To generate the Anza PAN file, our team first evaluates the PAN file provided by a manufacturer or third party.
For manufacturer PAN files, it’s critical that the parameters match the module datasheet. In addition, because manufacturer PAN files lack published test data, their performance is compared to other PAN files to ensure that performance is neither too optimistic nor too conservative.
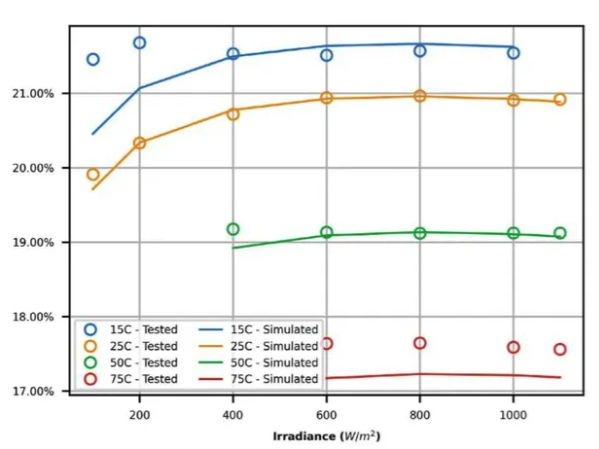
For third-party PAN files, the process is a bit longer. First, the PAN file is checked to ensure that certain electrical characteristics (Isc, Voc, etc.) match the datasheet. The associated PAN file report is also reviewed to ensure that the third-party lab followed recommended IEC test procedures to generate the test data; reports from labs that don’t test enough samples, for example, will be rejected. If the report is acceptable, simulation data is generated and compared against the test data. PAN files that generate poor simulation data relative to test points also will be rejected. In the image below, it is easy to see that the PAN file’s efficiency curve and test data points do not line up, which shows a poor fit.
After identifying which base PAN file to use, Anza determines values for LID, IAM, bifaciality factor, and power tolerance. Again, each LID, IAM, and the bifaciality factor have default values that are used in the absence of quality test data.
With all values determined, the Anza team makes the appropriate edits to the base PAN file and creates an “Anza PAN File”, giving it the final blessing to be used for module rankings in the platform.
Why even a third-party PAN file needs additional review
PAN files are one of the most critical components in PV performance modeling. If a module buyer is comparing a manufacturer PAN file to a third-party PAN file, the latter is typically more dependable. However, third-party PAN files can’t just be accepted as is without a level of detailed technical review to assess their viability. Anza undergoes a rigorous vetting process of these two different PAN file types to ensure that only the most accurate and, thus, bankable PAN files are used in our platform and technical and financial module analysis.
Module buyers can see Anza’s PAN files during the shortlist process or if they’ve already purchased through Anza before. If you are a module buyer and haven’t seen how Anza expands your module pool or rapidly helps you see the financial value between modules, submit your next project at app.anzarenewables.com.